When you put workloads on Kubernetes, most of your debugging and hunting for errors can quickly escalate into a murder mystery. Not much to a surprise, this was also the case for parts of our Prometheus stack.
A few words on Prometheus: Once you start out using Prometheus, it might be a bit cumbersome and high initial investment, but as soon as you gather the data, you will be able to do a lot of great things just because the data is there. So if you are starting with it: Just keep going!
Out of memory
We’re running Prometheus in a highly distributed environment and on many clusters. The workloads of those clusters are also vastly different, so a one-size-fits-all approach usually does not cut straight to the final solution. I was checking onto some metrics of one compute node late evening to check on a few things and build a theory about another issue we were seeing. I noticed that the data wasn’t available in Grafana anymore and soon discovered that the Prometheus is pushing the compute node out of its 32G memory – Bummer. This felt like a lot also for the size of the cluster it was running on. So my search began to figure out why Prometheus uses that much memory.
Dangerous Defaults
One thing I encounter over and over in modern systems is something I started to call dangerous defaults (or better “Did Not RTFM-Defaults”), as I trust every developer and engineer that no defaults in technology exist for truly malicious reasons. Most of the time those defaults have reasons, which can be discovered by reading through the entire history of said feature. I’ve started to try to document the reasoning for default values when I encounter them. This helps future-me to be proud of past-me and shows why values are set to specifics.
TSDB Top 10 Metrics
I started to look at the failing Prometheus node and saw that there’s a handy overview of a lot of Time Series Database (TSDB) vitals which includes Top 10 metrics stored. Which produced the following output:
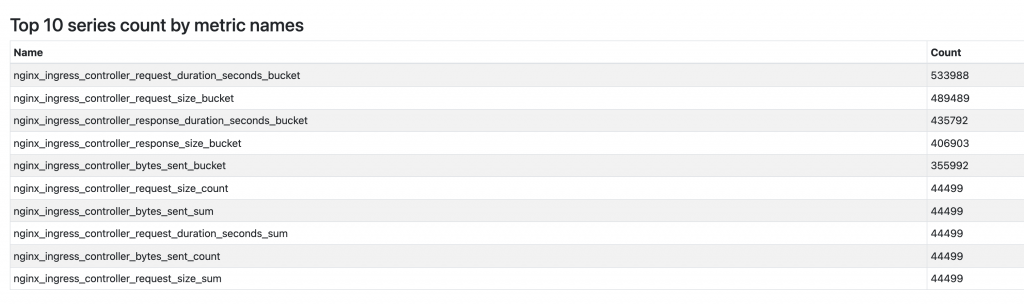
A few metrics stand out by order of magnitude. After checking those metrics I saw that we currently do not need to store them as we don’t make use of those metrics. So we decided to drop those metrics. Here it gets a bit tricky as I didn’t find any good resources on how this is actually done. To cut to the chase: What you will be looking for is metricRelabelings. As we’re using the helm chart for rolling out the ingress-nginx to our clusters it resulted in the following snippet.
      metricRelabelings:
        - action: drop
          regex: '(nginx_ingress_controller_request_duration_seconds_bucket|nginx_ingress_controller_response_size_bucket|nginx_ingress_controller_request_size_bucket|nginx_ingress_controller_response_duration_seconds_bucket|nginx_ingress_controller_bytes_sent_bucket)'
          sourceLabels: [__name__]
Cleanup
After the change above is rolled out, the TSDB Buckets will remain high but should not add more data. There is a way to drop those from the TSDB via the API, e.g. api/v1/status/tsdb will give you the seriesCountByMetricName and then it’s a few calls to drop those buckets via /api/v1/admin/tsdb/delete_series alternatively you do the no-ops approach and wait till the buckets get rotated away from the TSDB or remove the TSDB if that is an acceptable approach (yes this is a 🔨 approach but you are here for it).
This helped us identify the memory-hogging metrics, lower the usage, and stabilize Prometheus because it wasn’t pushing out the infra node in the cluster out of memory occasionally.

As you can see, the usage went from around 24G of memory usage down to approximately 14G, which is much more practical.
One contributing factor that helped us in this case: In more prominent clusters, we run compute nodes that do specific tasks, e.g. Loadbalancing or Monitoring/Infra, which would be two node groups kept separate from customer-facing workloads to limit issues e.g. OOM Situations to those Nodes or run specific compute nodes tailored to those workloads.